


Virtual Consultants Australia · Analytics & Dashboards
Live Analytics, Dashboards & Forecasting
See what is happening. Know what to do next.
Stop waiting for monthly spreadsheets. Live reporting and forecasts you can trust, built on your own data and shaped around the questions your leaders actually ask.
 Looker StudioLive refreshAI forecasting
Request a free reporting health check
Tell us what you report on today and we will show you the quickest dashboard win.
What it is
One trusted view of the business, updated automatically
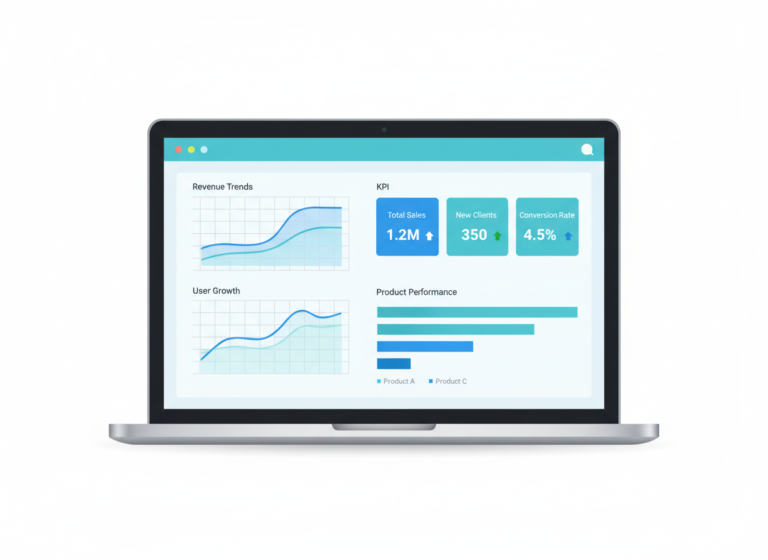
Dashboards and forecasts that replace manual reports, so decisions are made on live numbers.
Executive dashboards
Revenue, pipeline, margin, cash and team performance on one screen.
Live reporting
Reports refresh from your systems on a schedule or in real time, no copy and paste.
Forecasting
Weighted and AI-assisted forecasts with clear assumptions and risk flags.
KPI design
We agree the definitions first, so everyone reads the same number the same way.
Self-serve analytics
Teams filter and drill down themselves without waiting on a report request.
Scheduled board packs
Reports delivered to inboxes every Monday morning, ready to present.
Live data flow
From raw data to a decision-ready dashboard
Data moves from your systems into one model and then into live reports. Each step lights up as it runs.
One model · one version of the truth
 Live KPIsForecastBoard pack
Modern analytics stack
Dashboards your team will actually open
We build on the tools you already use, and keep the design simple enough that people trust it and use it every day.
- Dashboards that refresh automatically from your source systems
- Clear KPI definitions agreed with your leaders up front
- Governed access so people only see what they should


Who it’s for
Leaders who are tired of chasing numbers
Ideal buyer
CEOs, COOs, finance and sales leaders who wait days for reports they cannot fully trust.
Questions we start with
- Which decisions do you make every week?
- Where do your numbers come from today?
- What does your board ask for that you cannot produce quickly?
Results we measure
- Report-prep time saved
- Forecast accuracy
- Dashboard adoption
- Time to answer a question
Pricing
Choose the plan that fits your team
Each plan has a one-time setup fee and a monthly subscription covering hosting, monitoring, updates and support. Pay annually and get 2 months free.
| Essentials | ProfessionalMost popular | Elite | |
|---|---|---|---|
| Setup (one-time) | $1,500 | $3,900 | $7,500 |
| Monthly subscription | $79 | $199 | $399 |
| Ideal for | Solo operators | Consultants and small teams | Growing practices |
| Dashboards | 1 starter dashboard | 3 dashboards | 6 dashboards |
| Data sources | Up to 2 | Up to 5 | Up to 10 |
| Refresh | Daily | Hourly | Near real time |
| Scheduled reports | Weekly email | Weekly and monthly | Custom schedules and board pack |
| Training | 1 hr | 2 hrs | 4 hrs and playbook |
| Support and SLA | Email, 2 business days | Email and chat, 1 business day | Priority, 4 business hours |
| Business Standard | Business PremiumMost popular | Enterprise | |
|---|---|---|---|
| Setup (one-time) | $11,900 | $29,900 | From $65,000 |
| Monthly subscription | $790 | $1,900 | From $4,500 |
| Ideal for | Up to 10 users | Up to 50 users, multiple teams | 50+ users, multi-entity |
| Dashboards | 10 | 30, with drill-down | Enterprise BI and governed semantic layer |
| Forecasting | Weighted forecast | AI-assisted forecast and risk flags | Predictive and scenario modelling |
| Data sources | Up to 15 | Up to 40 | Unlimited |
| Governance | Role-based access | Plus audit logs and row-level security | Plus data-classification hooks and SSO |
| Support and SLA | 99.9% uptime, 4-hr response | 99.9% uptime, 2-hr response | 99.95% uptime, named TAM |
All prices in AUD and exclude GST. Enterprise is “from” pricing; a scoped quote follows discovery. Third-party licences (BI seats and similar) are billed at cost plus handling. Minimum term 12 months for monthly subscriptions.
FAQs
Common questions
Which dashboard tools do you use?
Power BI, Looker Studio, Metabase and Tableau, chosen to fit the tools and licences you already have.
Can you connect data from several systems?
Yes. We connect your CRM, finance, website and ad platforms into one model so numbers match across reports.
Do you also build the data pipelines behind the dashboards?
Yes. See our Data Engineering & Pipelines service, which bundles well with Analytics & Dashboards and CRM & Reporting.
How do I find out where to start?
Request a free reporting health check and we will review your reports, sources and KPIs.